|
| Xplor-NIH home Documentation |
Next: Building Hydrogen Positions Up: Cartesian Coordinates Previous: Rms Differences between Coordinates
|
| Xplor-NIH home Documentation |
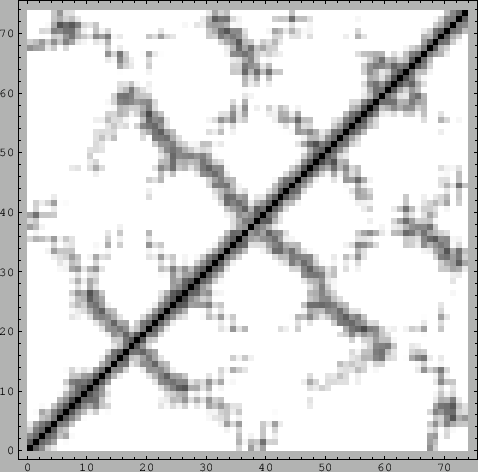
A file “distance.matrix" is produced, which can be interpreted by Mathematica using the following statements:
The resulting density plot of the distance matrix is shown in Fig. 6.3.
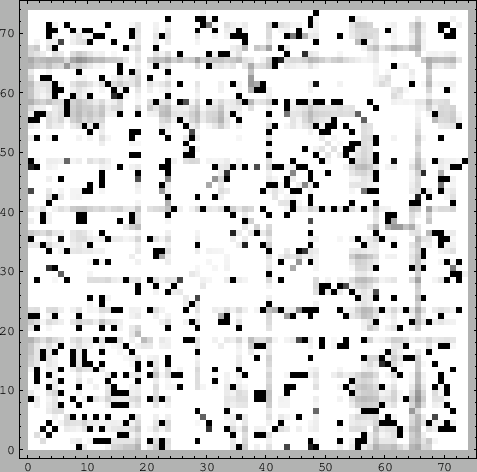
The pick bond statement is used to produce the distance matrix. It can be replaced by any other statement or series of statements in X-PLOR. For example, one could compute the interaction energy between the pair of residues using the constraints interaction and the energy statements (see Section 4.7). In the next example, a distance difference matrix is produced between two coordinate sets:
After interpreting the file “distance diff.matrix" with Mathematica, one obtains the plot shown in Fig. 6.4.