
| bit | Xplor-NIH | VMD-XPLOR |
|---|
|
| Xplor-NIH home Documentation |
Next: Analysis of Refined Structures Up: Individual B-Factor Refinement Previous: Requirements
Example
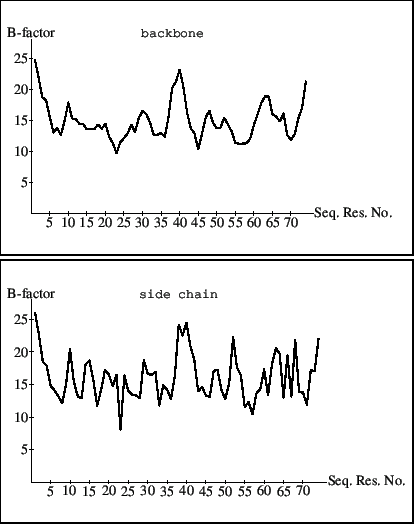
The following example performs overall B-factor refinement, followed by restrained individual B-factor refinement:brefinement.inp The B-factors can be plotted as a function of residue number by first running the following X-PLOR protocol, which produces a text file “bfactorplot.list":
bfactorplot.inp In the second step, a Mathematica script file can be used to produce the B-factor plots shown in Fig. 14.2 for both backbone and side-chain atoms:
Xplor-NIH 2026-07-10