
| bit | Xplor-NIH | VMD-XPLOR |
|---|
|
| Xplor-NIH home Documentation |
Next: Analysis of the PC-refinement Up: Generalized Molecular Replacement Previous: Cross-Rotation Function with the
PC-Refinement of the Highest Peaks of the Cross-Rotation
Function
The next step is to carry out where
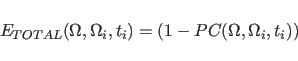
The angle brackets denote an averaging over the set of observed
reflections expanded to ![]() .
.
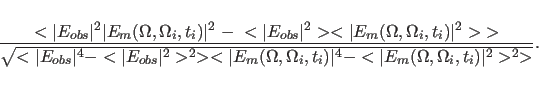
![]() denotes the normalized observed
structure factors, and
denotes the normalized observed
structure factors, and
![]() denotes the
normalized structure
factors of the search model
placed
in a triclinic unit cell identical in geometry to
that of the crystal.
denotes the
normalized structure
factors of the search model
placed
in a triclinic unit cell identical in geometry to
that of the crystal.
In the following example, PC-refinements of the search model are carried out where the model is oriented according to each of the 240 selected peaks of the rotation function listed in the file “rotation.rf".
This file produces a new listing stored in the file “filter.list".
It contains the results of the ![]() -refinement.
The following shows a few lines of this file:
-refinement.
The following shows a few lines of this file:
20.765 70 253.45     20.173 68.125 253.61     1 1.2 1.08E-02 3.03E-02 7.10E-02
35.554 75 68.657     36.231 76.77 70.961      6 1.1 2.29E-02 2.97E-02 6.13E-02
9.555 67.5 257.06     10.617 65.649 254.72    7 1.1 1.13E-02 2.02E-02 5.75E-02
34.519 75 249.69     33.645 72.563 251.84     8 1.1 1.97E-02 2.97E-02 6.51E-02
It lists the orientations before and after
filter.math The result of the filtering procedure is shown in Fig. 19.3.
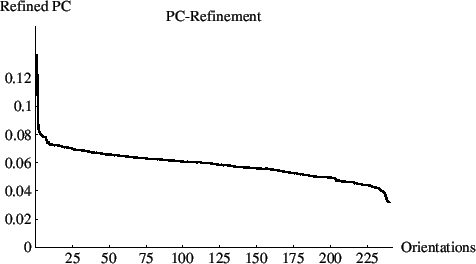
A single peak is produced. It corresponds to the
orientation
(![]() =274.45,
=274.45, ![]() =35,
=35, ![]() =324.68)
before and
(
=324.68)
before and
(![]() =275.06,
=275.06, ![]() =34.905,
=34.905, ![]() =324.7)
after
=324.7)
after ![]() -refinement.
-refinement.
Xplor-NIH 2026-07-10