
| bit | Xplor-NIH | VMD-XPLOR |
|---|
|
| Xplor-NIH home Documentation |
Next: Wilson Plot Up: Crystallographic Diffraction Data Previous: Special Positions
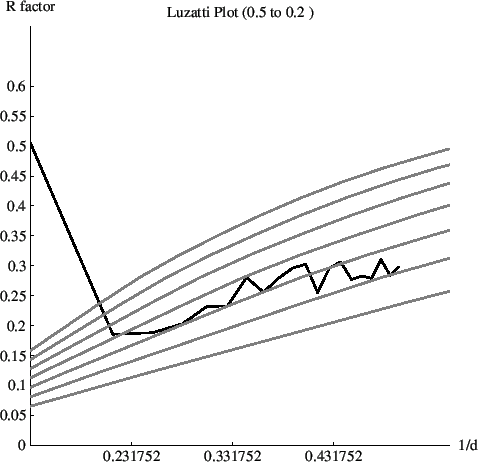
Luzzati Plot
The The following Mathematica script can be used to make the Luzzati plot shown in Fig. 13.1:
Xplor-NIH 2026-07-10