
| bit | Xplor-NIH | VMD-XPLOR |
|---|
|
| Xplor-NIH home Documentation |
Next: Pairwise Rmsds Up: NMR Structure Determination Previous: Acceptance of Refined NMR
Average Structure and Rmsds
The example input file below shows how to compute average coordinates and rms differences (rmsds) from the mean for a family of coordinates. For the computation of the rmsds between independent coordinates (e.g., between an NMR-derived structure and a crystal structure) and the analysis of distance differences, the reader is referred to Chapter 6. The example file produces a new coordinate file (“average.pdb"), which contains the average coordinates in the x,y,z positions and the rmsds in the b (B-factor) position of the PDB coordinate file. The remarks records of the coordinate file also contain information about the overall rmsd for both backbone atoms and nonhydrogen atoms.
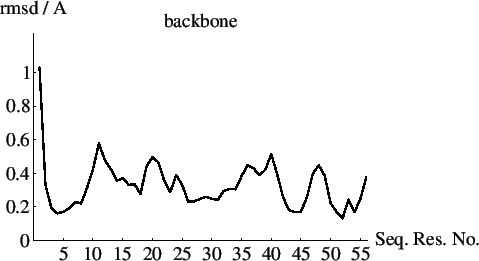
The input file below shows how to plot the rmsds provided by the “average.pdb" coordinate file:
The resulting text file “average plot.list" can be plotted by Mathematica using the following script file. The result is shown in Fig. 38.2.
Next: Pairwise Rmsds Up: NMR Structure Determination Previous: Acceptance of Refined NMR Contents Index