
| bit | Xplor-NIH | VMD-XPLOR |
|---|
|
| Xplor-NIH home Documentation |
Next: Ramachandran Plot Up: Geometric and Energetic Analysis Previous: Deviations from Ideality and
Conformation vs. Residue Number
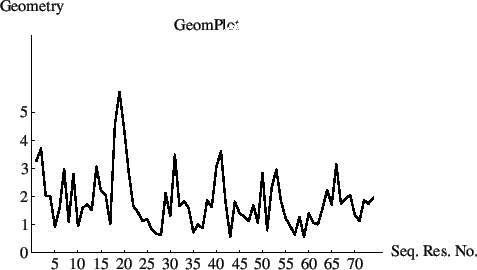
The following example file shows how to produce a print or plot
file that indicates the deviations of bonds and bond, dihedral,
and improper angles from ideality as a function of residue number.
This information is useful for crystallographic refinement
(Chapter 14) as well as NMR
structure refinement (Chapter 20). It can be used
to localize problems in the refined coordinates.
The following Mathematica file was used to produce the plot shown in Fig. 5.1. The information is plotted as a function of sequential residue number.
The resulting plot looks like this:
The correspondence between sequential residue number and actual residue identifier can be established by issuing the following statements:
vector ident (store1) ( tag )
vector show element ( store1 ) ( attr store1 > 0 )
A particular residue identifier can be queried by saying
vector ident (store1) ( tag )
vector show element ( store1 ) ( attr store1 = 41 )
which will show the residue identifier that corresponds to the 41st sequential residue.
Next: Ramachandran Plot Up: Geometric and Energetic Analysis Previous: Deviations from Ideality and Contents Index