
| bit | Xplor-NIH | VMD-XPLOR |
|---|
|
| Xplor-NIH home Documentation |
Next: Computational Caveat Up: XPLOR Interface Manual Previous: Analysis of Refined Structures
Fiber Structure Refinement
Xplor-NIH now incorporates the functionality of the FX-PLOR package of computer programs for macromolecular refinements against X-ray fiber diffraction data (Wang and Stubbs, 1993; Denny et al., 1997). Most features in X-PLOR suitable for crystal structure refinement and structure analysis can be utilized for fiber structure refinement and analysis.
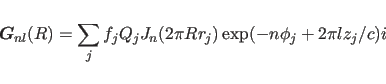
In X-ray fiber diffraction, the Fourier-Bessel structure factor
is defined as:
 |
(15.1) |
 |
(15.2) |
Fiber diffraction intensities are usually
measured at small sampling unit ![]() along the layer line,
where
along the layer line,
where ![]() is a constant in reciprocal space. Because the
sampling unit is usually small, it is convenient to index the
intensity data with reciprocal space index
is a constant in reciprocal space. Because the
sampling unit is usually small, it is convenient to index the
intensity data with reciprocal space index
![]() and layer line number
and layer line number ![]() . In FX-PLOR,
. In FX-PLOR,
![]() and
and ![]() are stored in H array and L array,
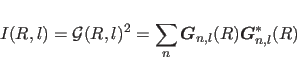
respectively. Moreover, because structure factor
are stored in H array and L array,
respectively. Moreover, because structure factor ![]() in
fiber diffraction is a multidimensional vector rather than a
two-dimensional vector, only amplitude of
in
fiber diffraction is a multidimensional vector rather than a
two-dimensional vector, only amplitude of ![]() is stored in
the real components of FCALC array and FOBS array.
is stored in
the real components of FCALC array and FOBS array.
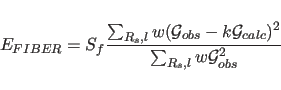
In order to include X-ray fiber diffraction information in a
molecular dynamics refinement or energy minimization, the
effective energy for fiber diffraction is defined as a function
of the discrepancy between observed and calculated intensities:
 |
(15.3) |
To reduce computational time, look-up tables for ![]() ,
,
![]() and Bessel function may be set up for structure factor
calculation, The size of the Bessel look-up table depends on
the following factors: resolution limit of the diffraction data,
maximum number of Bessel terms on a layer line (BLMAX) and grid
size of the table for Bessel function (TGRID).
and Bessel function may be set up for structure factor
calculation, The size of the Bessel look-up table depends on
the following factors: resolution limit of the diffraction data,
maximum number of Bessel terms on a layer line (BLMAX) and grid
size of the table for Bessel function (TGRID).
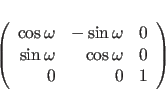
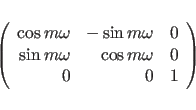
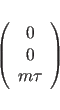
The basic symmetry relation of a helical structure is a screw
rotation ![]() . In FXPLOR, these symmetry relations can
be utilized in potential energy calculation for non-bonded
interactions between atoms in different subunits. The rotation
matrix
. In FXPLOR, these symmetry relations can
be utilized in potential energy calculation for non-bonded
interactions between atoms in different subunits. The rotation
matrix ![]() of the screw rotation is:
of the screw rotation is:
where
 |
(15.6) |
The sign in formula (15.7) is determined by the handedness of the helix. A right handed helix has a positive value while left-handed helix has a negative value. Other symmetry relations can be derived from (15.4) and (15.5):

 |
(15.8) |
 |
(15.9) |
Subsections
- Setting up Fiber Structure Parameters and Diffraction Information: The Fiber_refin Statement
- Example: setting up structure parameters and fiber diffraction data of a helical virus structure
- Example of fiber diffraction file
- Computation of Electron Density Maps of a helical structure
- Symmetric Linkage
Next: Computational Caveat Up: XPLOR Interface Manual Previous: Analysis of Refined Structures Contents Index