
| bit | Xplor-NIH | VMD-XPLOR |
|---|
|
| Xplor-NIH home Documentation |
Next: Non-crystallographic Symmetry Up: XPLOR Interface Manual Previous: Example: Heavy Atom Derivative
Cross-validation: The Free  Value
Value
X-PLOR provides the possibility of cross-validation
in reciprocal space, as described by
Brünger (1992,1993).
The most common measure of the quality of a crystal structure is the
![]() value (Eq. 13.2).
value (Eq. 13.2).
![]() is closely related to the crystallographic
residual (cf. Eq. 13.1)
is closely related to the crystallographic
residual (cf. Eq. 13.1)
Crystallographic diffraction data are redundant to some degree; e.g.,
a small portion of the
data can be omitted without seriously affecting the
result.
Following the statistical concept of
cross-validation,
the observed reflections are partitioned into a test set ![]() and a
working set
and a
working set ![]() (Brünger 1992); that is,
(Brünger 1992); that is,
![]() and
and ![]() are
disjoint, and their conjunction is the full set of
observed reflections.
The value
are
disjoint, and their conjunction is the full set of
observed reflections.
The value
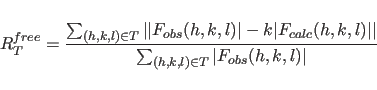 |
(17.2) |
One would expect
Both ![]() and the
rms difference between the model refined against the complete data
set and the model refined against
and the
rms difference between the model refined against the complete data
set and the model refined against ![]() increase more or less monotonically as a function of
the percentage of omitted data. This is to be
expected of terms that monitor the validity of a model.
increase more or less monotonically as a function of
the percentage of omitted data. This is to be
expected of terms that monitor the validity of a model.
![]() decreases,
which is a paradoxical and misleading behavior for an indicator of the
model's accuracy. As a compromise between
avoiding fluctuations of
decreases,
which is a paradoxical and misleading behavior for an indicator of the
model's accuracy. As a compromise between
avoiding fluctuations of ![]() and maintaining small rms differences between refined models, obtain
and maintaining small rms differences between refined models, obtain ![]() from
a random selection of 10% of the observed reflections.
from
a random selection of 10% of the observed reflections.
The free ![]() value (or correlation coefficient)
is printed along with the conventional
value (or correlation coefficient)
is printed along with the conventional
![]() value (correlation coefficient) during all
refinement procedures in X-PLOR, including
value (correlation coefficient) during all
refinement procedures in X-PLOR, including ![]() -refinement
for molecular replacement. In addition, the data
analysis can be carried out for both the test set
-refinement
for molecular replacement. In addition, the data
analysis can be carried out for both the test set ![]() and
the working set
and
the working set ![]() when one is using the “PRINt R", “PRINt PHASe",
and “PRINt COMPleteness" statements. The
when one is using the “PRINt R", “PRINt PHASe",
and “PRINt COMPleteness" statements. The ![]() values or
correlation coefficients are stored in the symbols
$R, $TEST R, $CORR, and $TEST CORR
whenever a computation of
values or
correlation coefficients are stored in the symbols
$R, $TEST R, $CORR, and $TEST CORR
whenever a computation of ![]() has been carried out, e.g,
when a “PRINt TARGet" statement has been issued or an
energy calculation has been carried out.
has been carried out, e.g,
when a “PRINt TARGet" statement has been issued or an
energy calculation has been carried out.
The following two example files show how to use the
free ![]() value concept in X-PLOR. Basically, none of the
example files described in the previous section
have to be changed. The only requirement is
to create a special reflection file that tells X-PLOR
which reflections belong to the test set and the
working set. This is indicated by the TEST array.
The example file below randomly selects 10% of the
data and sets the TEST array to 1 for them. Subsequently,
a new reflection file “amy.cv" is written that should be
used for all subsequent X-PLOR runs. X-PLOR
automatically partitions the data into the
working set and the test set whenever the TEST array
contains nonzero elements. The reflections with
TEST=1 are used for the free
value concept in X-PLOR. Basically, none of the
example files described in the previous section
have to be changed. The only requirement is
to create a special reflection file that tells X-PLOR
which reflections belong to the test set and the
working set. This is indicated by the TEST array.
The example file below randomly selects 10% of the
data and sets the TEST array to 1 for them. Subsequently,
a new reflection file “amy.cv" is written that should be
used for all subsequent X-PLOR runs. X-PLOR
automatically partitions the data into the
working set and the test set whenever the TEST array
contains nonzero elements. The reflections with
TEST=1 are used for the free ![]() value (correlation)
computation.
value (correlation)
computation.
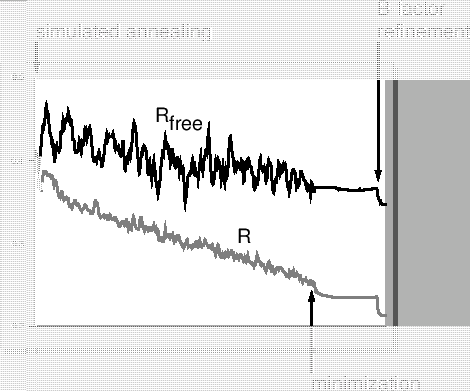
The example file below is a combination of the slow-cooling simulated annealing refinement cycle described in Section 14.1.3 and the restrained B-factor refinement described in Section 14.4. Note that no change was required in the input files except for using the “amy.cv" reflection file.
As a consequence of the SA-refinement with the test set
omitted, the free ![]() value deviates from the
conventional
value deviates from the
conventional ![]() value. However, the free
value. However, the free ![]() value
decreases during the course of the refinement, even
though the test set of reflections has been omitted from
the refinement process. This indicates that the
information content and phase accuracy of the model
increase during the refinement process. If at
any stage in the refinement process--e.g., after
refining additional water molecules--the free
value
decreases during the course of the refinement, even
though the test set of reflections has been omitted from
the refinement process. This indicates that the
information content and phase accuracy of the model
increase during the refinement process. If at
any stage in the refinement process--e.g., after
refining additional water molecules--the free ![]() value
increased, it would indicate that the phase accuracy
of the model was worsened by the additional refinement.
The free
value
increased, it would indicate that the phase accuracy
of the model was worsened by the additional refinement.
The free ![]() value can thus be used to prevent the user
from overfitting the diffraction data.
value can thus be used to prevent the user
from overfitting the diffraction data.
Figure 17.1 was produced by obtaining the
free and conventional ![]() values using the UNIX
grep facility from the X-PLOR output file
(searching for “TEST=1" and “TEST=0").
The resulting lines were fed into a spreadsheet
program.
values using the UNIX
grep facility from the X-PLOR output file
(searching for “TEST=1" and “TEST=0").
The resulting lines were fed into a spreadsheet
program.
Next: Non-crystallographic Symmetry Up: XPLOR Interface Manual Previous: Example: Heavy Atom Derivative Contents Index